For instructions on installing the Dart or Flutter extensions, go here.
v2.13.2 2018-06-06
- A memory leak in code completion has been fixed, so Dart Code should no longer get slower over time
v2.13.1 2018-06-05
- If you have only a single emulator it will no longer immediately launch upon pressing
F5, instead showing the usual prompt to give you the option of connecting a physical device - Using the
Create method 'xxx'quick fix to create methods in classes in other files will no longer incorrectly insert the code into the current file - Completions for methods that already include arguments such as
setStatewill no longer have additional parenthesis added on to the end - The
newkeywords have been removed from Flutter snippets - Relative paths for Flutter test scripts in
launch.jsonwill now correctly be detected as tests and not try to run on devices
v2.13.0 2018-06-01
Emulator Launching
Emulators can now be launched directly from within Code. If you start debugging without a connected device you’ll be presented with a list of emulators on your system to launch.
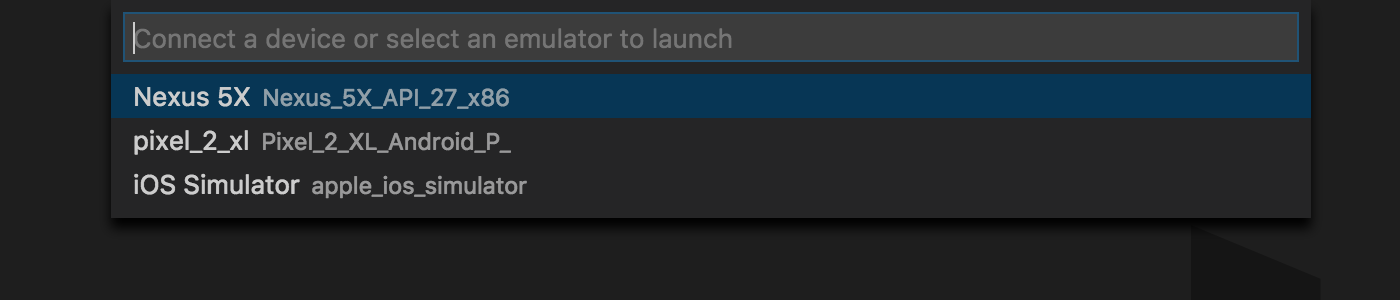
After selecting a device a notification will appear while the device boots and connects.
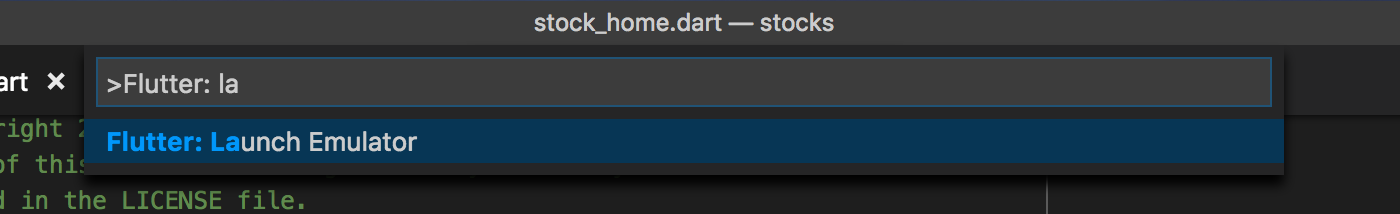
You can also trigger the emulator selection by clicking on No devices in the status bar or by running the Flutter: Launch Emulator command from the command palette.
This feature relies on support from the Flutter tools which means it will only show emulators when using a very recent Flutter SDK. Flutter’s master channel already has this change, but it may take a little longer to filter through to the dev and beta channels.
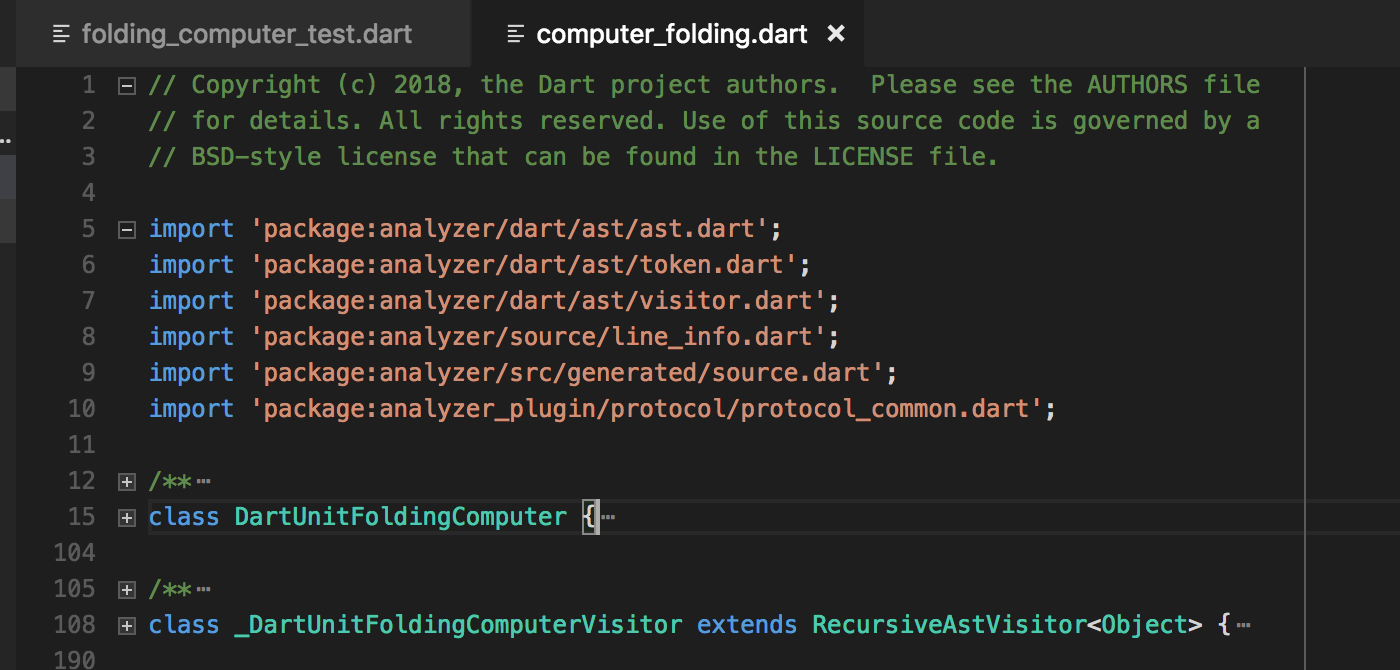
Improved Folding
Code folding is now handled by Dart Code rather than being done by VS Code based on indenting. This should result in more accurate folding regions and also allows collapsing file headers and directives.
This feature relies on support from the Dart analysis server which means it will only activate when using a very recent SDK. Flutter’s master channel already has this change, but it may take a little longer to filter through to the dev and beta channels.
Flutter: New Project Improvements
New settings have been added to customize the Flutter: New Project command:
dart.flutterCreateOrganization: Used in Java package names and as prefix in the iOS bundle identifierdart.flutterCreateIOSLanguage: The programming language to use for IOS apps (objcorswift)dart.flutterCreateAndroidLanguage: The programming language to use for Android apps (javaorkotlin)
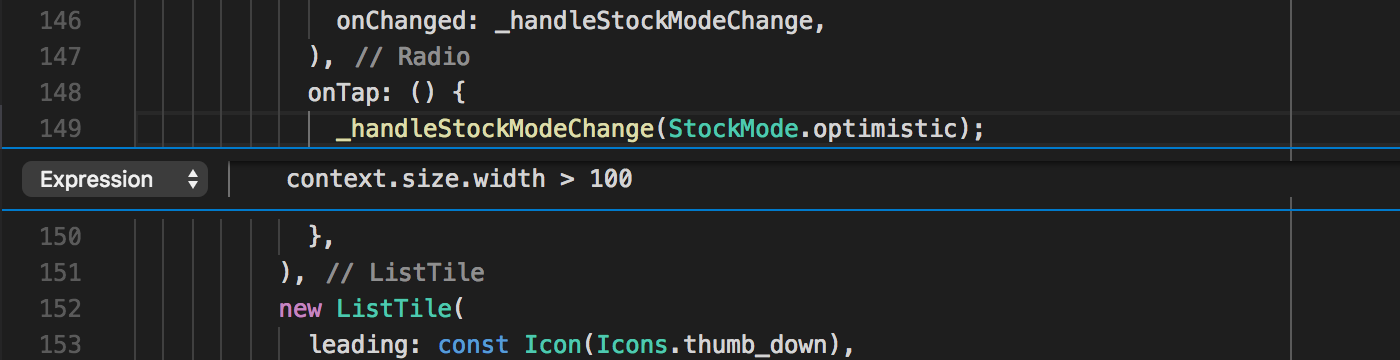
Debugger: Conditional Breakpoints and Log Points
You can now set Conditional breakpoints that will only break if the provided condition is true.
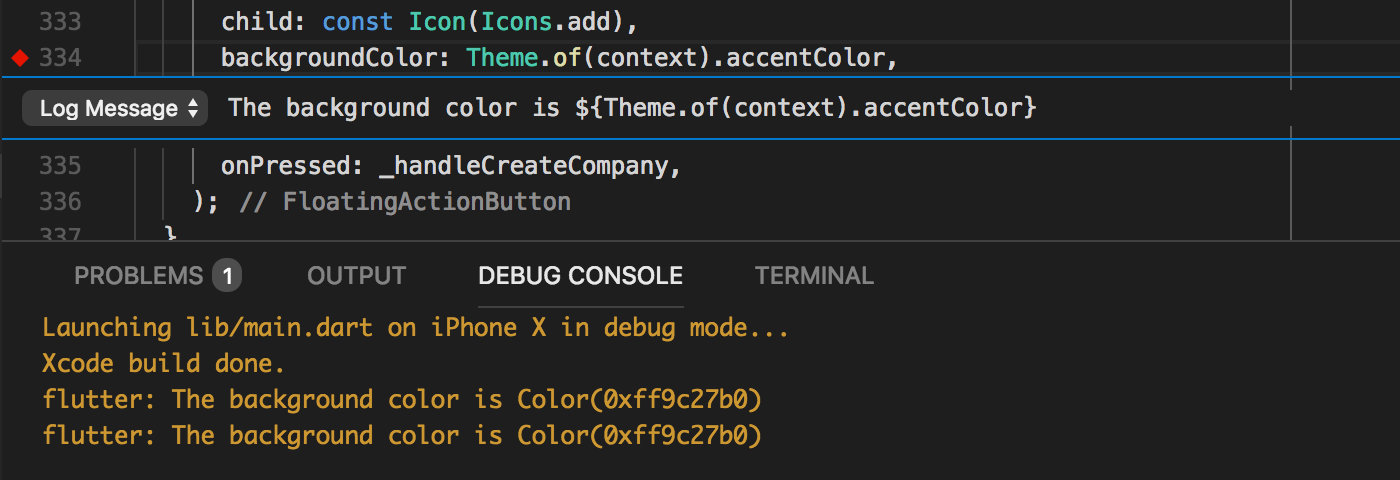
Log Points are like Breakpoints but rather than pausing execution they simply print() the message and then continue. This allows you to add debug information without having to insert print()s and reload the application or revert them when committing code. Like breakpoints, they also persist across sessions.
Debugger: Start from Explorer
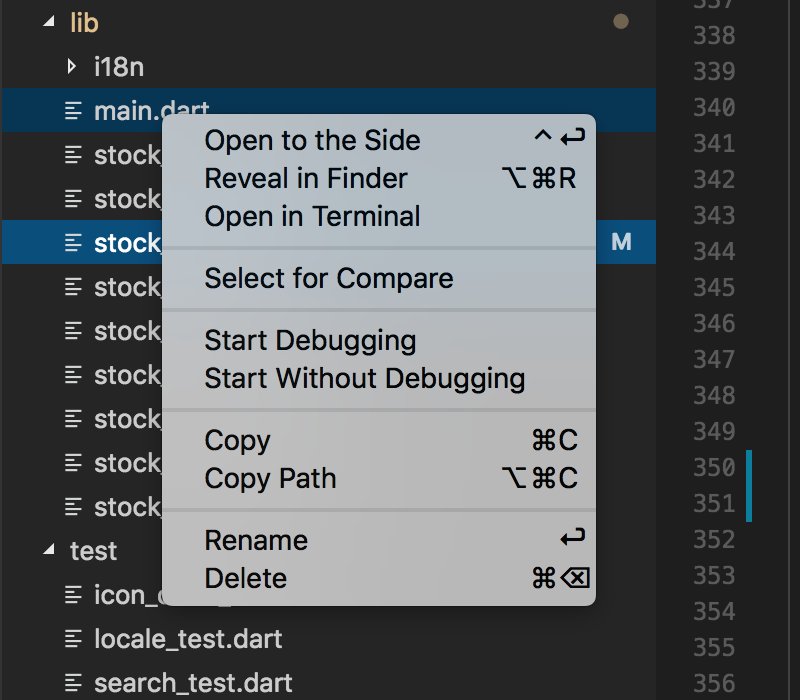
You can now run specific scripts directly from the Explorer pane using the Start Debugging and Start Without Debugging options on the context menu. This bypasses what’s in launch.json and uses default behaviour for the given file (this includes selecting the correct debugger based on whether the script looks like Dart or Flutter and is in a test folder).
Debugger: Attach to Process
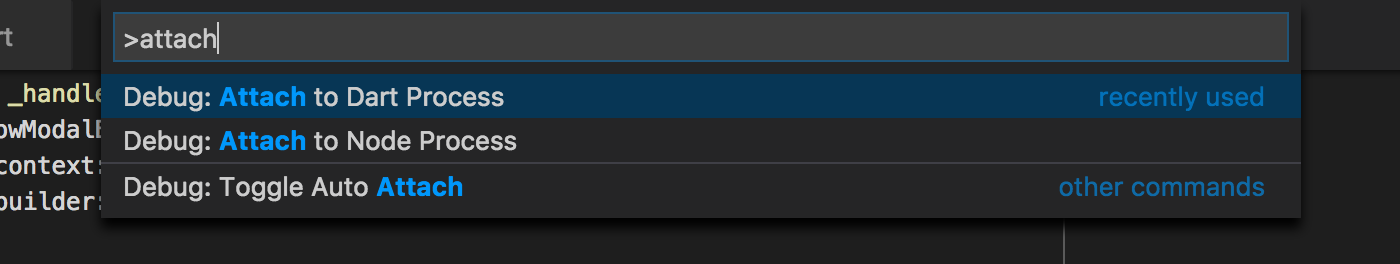
@stuartmorgan contributed Dart: Attach to Process which allows attaching the debugger to an existing process that you have an Observatory URL or port number for. You can configure this in your launch.json by setting request to attach or by simply running the Debug: Attach to Dart Process command.
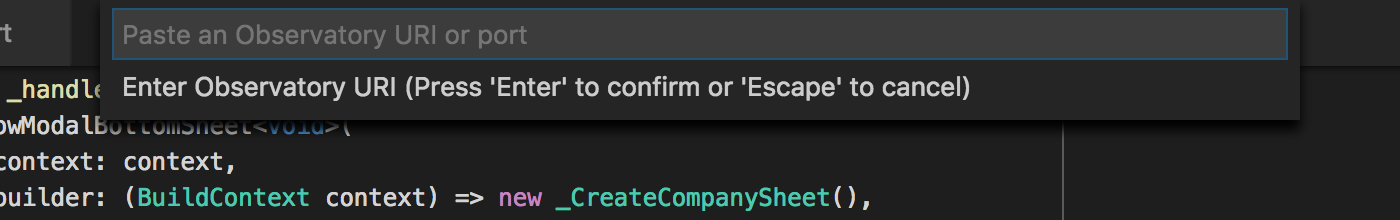
You can also provide the observatoryUri in launch.json to skip this prompt when launching with F5.
Note: In this version the standard Dart debugger is attached, which means Flutter-specific functionality like hot reload will not be available.
Other Debugger Changes
- Setting
vmAdditionalArgsinlaunch.jsonallows you to pass custom arguments to the VM when launching Dart applications Lists andMaps will now render consistently between the Variables Watch debugger panes- Adding
ListandMapentries to the watch window is now more reliable andAdd to Watchwill be disabled for items where it is not supported - @tfriem contributed including indexes in the display of
Mapentries in the debugger Variables and Watch panes to avoid items with identical display text being de-duped by VS Code - @tfriem contributed displaying complex
Mapkeys in the debugger Variables and Watch panes - Debugger tooltips will now show more descriptive type names (eg.
Stringin addition to_OneByteString) - Stepping into SDK sources while debugging will no longer cause analysis server exceptions
Full Restarthas been renamedHot Restart- A race condition that could cause unwanted
Continues during debugger startup has been fixed - A race condition that could cause
debugExternalLibraries/debugSdkLibrariessettings to not apply correctly has been fixed - Resolving variables like
${workspaceFolder}insideprogramandcwdinlaunch.jsonhas been improved and now better supports launching programs from sub folders launch.jsonnow supports relative paths and does not require${workspaceFolder}prefixes forprogramorcwd- On Windows, Dart VM processes for CLI apps should be cleaned up better when clicking the Stop button on the debug toolbar
- The Observatory Log File will now include launch information for the process, including arguments
Editor Changes
Organize Directiveshas been renamed toOrganize Importsas this is now a shared action across languages in VS Code- A
Refactoroption is now available on the context menu for improved visibility (the items shown are a filtered list of the existing lightbulb menu) - The
Organize Importsaction now appears in theSource Actioncontext menu - The
Sort Membersaction now appears in theSource Actioncontext menu - The
dart.organizeDirectivesOnSavesetting has been removed in favor of Code’s newcodeActionsOnSavefunctionality. To achieve the same functionality you can set the following in your settings:"editor.codeActionsOnSave": { "source.organizeImports": true } - Rename is now supported in more places (for example if you press
F2on theclasskeyword it will rename the class or on an import it will add or edit the prefix) - Tooltips for types from external packages will now show the package name at the top of the documentation
- The completion list will now refresh when typing a
/or\inside an import path to provide completion for nested folders/files - Keywords will no longer highlight incorrectly if followed by an opening paren (eg.
if(1)) - Opening Git diff views will no longer incorrectly use the original file for analysis
Other Changes
- A prompt to open release notes will now show when Dart Code is updated
- A warning will be shown if the casing of the folder you have opened differs from that on the underlying disk as this may cause unexpected analysis errors from consolidating
package:and relative paths - Changes to most log file settings will no longer require an extension reload
- Using
--preview-dart-2for the Dart VM will no longer give errors about not being compatible with checked mode - Running
Flutter: Get Packagesin the Flutter repository will now runflutter update-packages - Prompts to upgrade folders in your workspace will no longer appear after a “silent” extension restart
- The Dart SDK version number has been removed from the status bar from Flutter projects (it was incorrect but may return in future)
- A workaround has been implemented to resolve an issue where Flutter commands like
Hot Reloadwould not work if the Visual Studio Live Sharing extension was installed due to the way it proxies debug sessions - The
dart.previewDart2setting (and associated launch configuration property) is no longer supported by Flutter and has been removed (if you were using this for CLI apps you can add--preview-dart-2tovmAdditionalArgsand/oranalyzerAdditionalArgs) - Running scripts from nested folders will now more accurately detect the type of project/script being run and as a result the prompt to upgrade folders to “Workspace Folders” has been removed (you can still manually add folders as Workspace Folders if desired)
Upstream Issues
Some feature requests and fixes require new features and fixes in upstream projects like VS Code and LSP which use counts of 👍s on those issues to help gauge demand. The Dart-Code website now lists some of the most significant upstream issues with a description of the feature/fix they would enable. Please consider reviewing this list and adding your 👍 to any GitHub issues relevant to features you’d like to see!