Enabling Logging
The simplest way to capture logs is using the Dart: Capture Logs command, however there are further commands that restrict the logging to certain sub-systems to help make finding issues easier due to reducing unwanted noise.
In addition to the available commands, there are also user settings to allow capturing detailed logs for an individual component over a longer period.
Capture Logs Commands
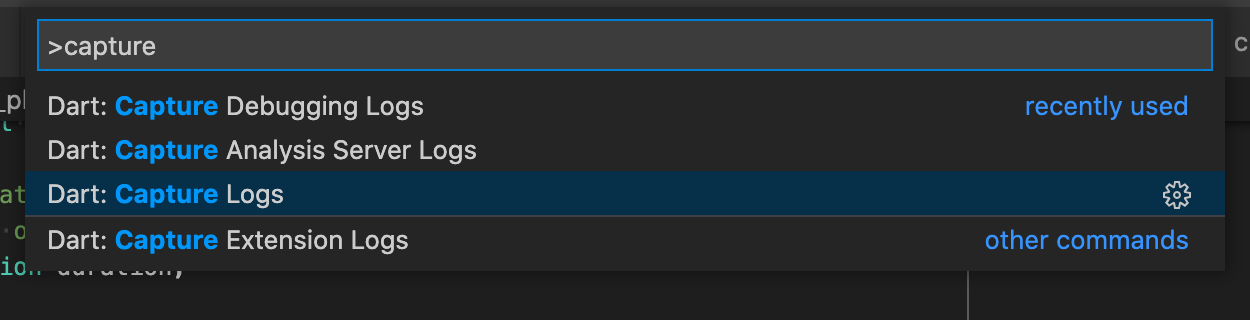
When you’re ready to reproduce your issue, run Dart: Capture Logs in the command palette, or any of the other commands below if you know which is most appropriate for your scenario.
You’ll be prompted to select which types of events to log. If you’re not sure which component is causing the issue, just leave them all ticked.
All logging commands, and what they do or do not capture, are listed below.
Capture Logs
A pickable list of events, with the capability to capture everything.
Capture Analysis Server Logs
Only captures Analyzer and CommandProcess events.
Capture Debugging Logs
Captures all events except Analyzer.
Capture Extension Logs
Only captures CommandProcess, DevTools, and FlutterDaemon events.
While the logs are being captured a notification will be shown.
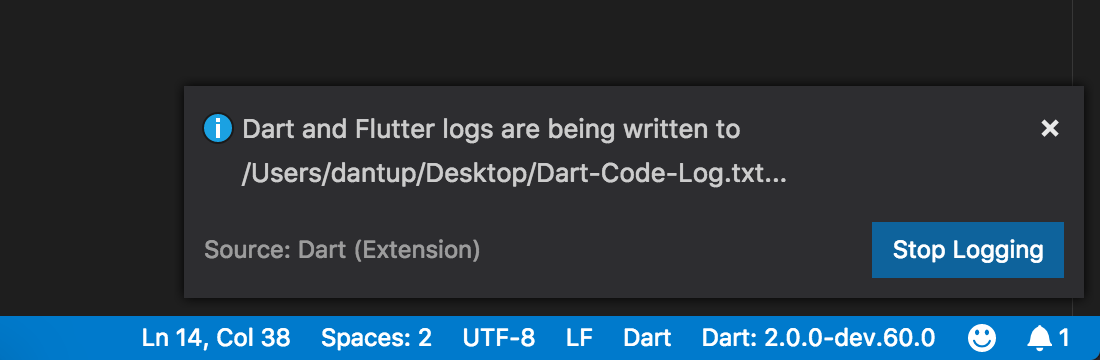
When you click Stop Logging the resulting log file will be opened in the editor for you. Please review the logs for any sensitive data (it may include parts of your files) before sharing.
Attach the log to a GH issue or if you don’t wish to post it publicly email it to logs@dartcode.org including a link to the related GH issue
Individual Logs
Individual log files can be enabled by setting the corresponding VS Code Settings.
General Extension Logging
The dart.extensionLogFile setting enables a low-traffic log file for basic extension and editor issues.
To capture an extension log file please do the following:
- Set
dart.extensionLogFileto a file path, for example/Users/dantup/Desktop/extension.txt - Restart VS Code
- Reproduce the issue
- Take a copy of the log file
- Review the log and remove any sensitive data
- Attach the log to a GH issue or if you don’t wish to post it publicly email it to logs@dartcode.org including a link to the related GH issue
Analysis Server Instrumentation Logging
The dart.analyzerInstrumentationLogFile setting enables very detailed logging in the analysis server that may be useful when trying to diagnose analysis server issues.
To capture an analysis server instrumentation log file please do the following:
- Set
dart.analyzerInstrumentationLogFileto a file path, for example/Users/dantup/Desktop/analyzerInstrumentation.txt - Reproduce the issue
- Take a copy of the log file
- Review the log and remove any sensitive data
- Attach the log to a GH issue or if you don’t wish to post it publicly email it to logs@dartcode.org including a link to the related GH issue
Analysis Server Logging
The dart.analyzerLogFile setting enables logging of communication between Dart Code and the analysis server. Messages are truncated after a few thousand characters but this is useful when trying to understand how Dart Code is interacting with the analysis server.
To capture an analysis server log file please do the following:
- Set
dart.analyzerLogFileto a file path, for example/Users/dantup/Desktop/analyzer.txt - Reproduce the issue
- Take a copy of the log file
- Review the log and remove any sensitive data
- Attach the log to a GH issue or if you don’t wish to post it publicly email it to logs@dartcode.org including a link to the related GH issue
Flutter Daemon Logging
The dart.flutterDaemonLogFile setting enables logging of the flutter daemon communication which is the service that provides information about connected devices that is used in the status bar.
To capture a flutter daemon log file please do the following:
- Set
dart.flutterDaemonLogFileto a file path, for example/Users/dantup/Desktop/flutterDaemon.txt - Reproduce the issue
- Take a copy of the log file
- Review the log and remove any sensitive data
- Attach the log to a GH issue or if you don’t wish to post it publicly email it to logs@dartcode.org including a link to the related GH issue
Flutter Run Logging
The dart.flutterRunLogFile setting enables logging of flutter run which is used to launch Flutter applications from VS Code. This is useful when trying to diagnose issues with applications launching (or failing to) on simulators and devices.
To capture a flutter run log file please do the following:
- Set
dart.flutterRunLogFileto a file path, for example/Users/dantup/Desktop/flutterRun.txt - Press
F5to run/debug the application - Reproduce the issue
- Take a copy of the log file
- Review the log and remove any sensitive data
- Attach the log to a GH issue or if you don’t wish to post it publicly email it to logs@dartcode.org including a link to the related GH issue
Flutter Test Logging
The dart.flutterTestLogFile setting enables logging of flutter test which is used to run unit tests from VS Code. This is useful when trying to diagnose issues with unit test executions.
To capture a flutter test log file please do the following:
- Set
dart.flutterTestLogFileto a file path, for example/Users/dantup/Desktop/flutterTest.txt - Open the file containing your tests
- Press
F5to run/debug the tests - Wait for the run to complete
- Take a copy of the log file
- Review the log and remove any sensitive data
- Attach the log to a GH issue or if you don’t wish to post it publicly email it to logs@dartcode.org including a link to the related GH issue
Dart Test Logging
The dart.pubTestLogFile setting enables logging of Dart test runs. This is useful when trying to diagnose issues with unit test executions.
To capture a Dart test log file please do the following:
- Set
dart.pubTestLogFileto a file path, for example/Users/dantup/Desktop/pubTest.txt - Open the file containing your tests
- Press
F5to run/debug the tests - Wait for the run to complete
- Take a copy of the log file
- Review the log and remove any sensitive data
- Attach the log to a GH issue or if you don’t wish to post it publicly email it to logs@dartcode.org including a link to the related GH issue
VM Service (Debugger) Logging
The dart.vmServiceLogFile setting enables logging of communication between Dart Code and the VM service (the debugger). This is useful when trying to diagnose issues with debugging such as missed breakpoints.
To capture a VM service log file please do the following:
- Set
dart.vmServiceLogFileto a file path, for example/Users/dantup/Desktop/vmService.txt - Press
F5to start debugging and reproduce your issue (for example, run the code that misses the breakpoint) - Stop debugging
- Take a copy of the log file
- Review the log and remove any sensitive data
- Attach the log to a GH issue or if you don’t wish to post it publicly email it to logs@dartcode.org including a link to the related GH issue