For instructions on installing the Dart or Flutter extensions, go here.
v2.15.0 2018-06-29
Test Runner
A new test runner has been added that will render test results in a tree in the Test Side Bar.
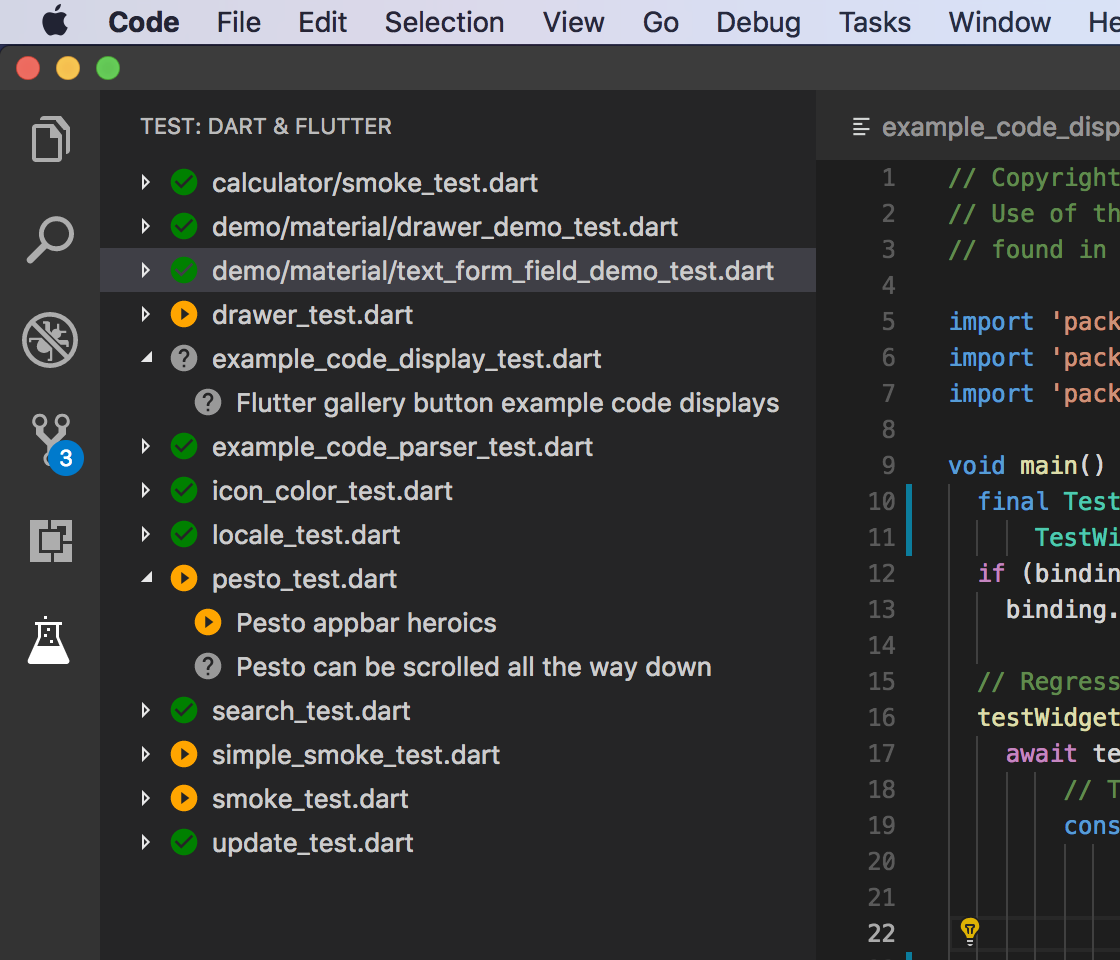
Currently there is no detection of tests so they will only appear once you start running them which can be done with F5/launch.json, using the Start Debugging/Start Without Debugging options on explorer context menus or using the new Run All Tests command (noted below) to run all test files.
Clicking on a test will open the Output pane if there is any output from the test and also navigate you to the test in the source (note: navigating to the source required a change in Flutter which is currently only available on the master channel).
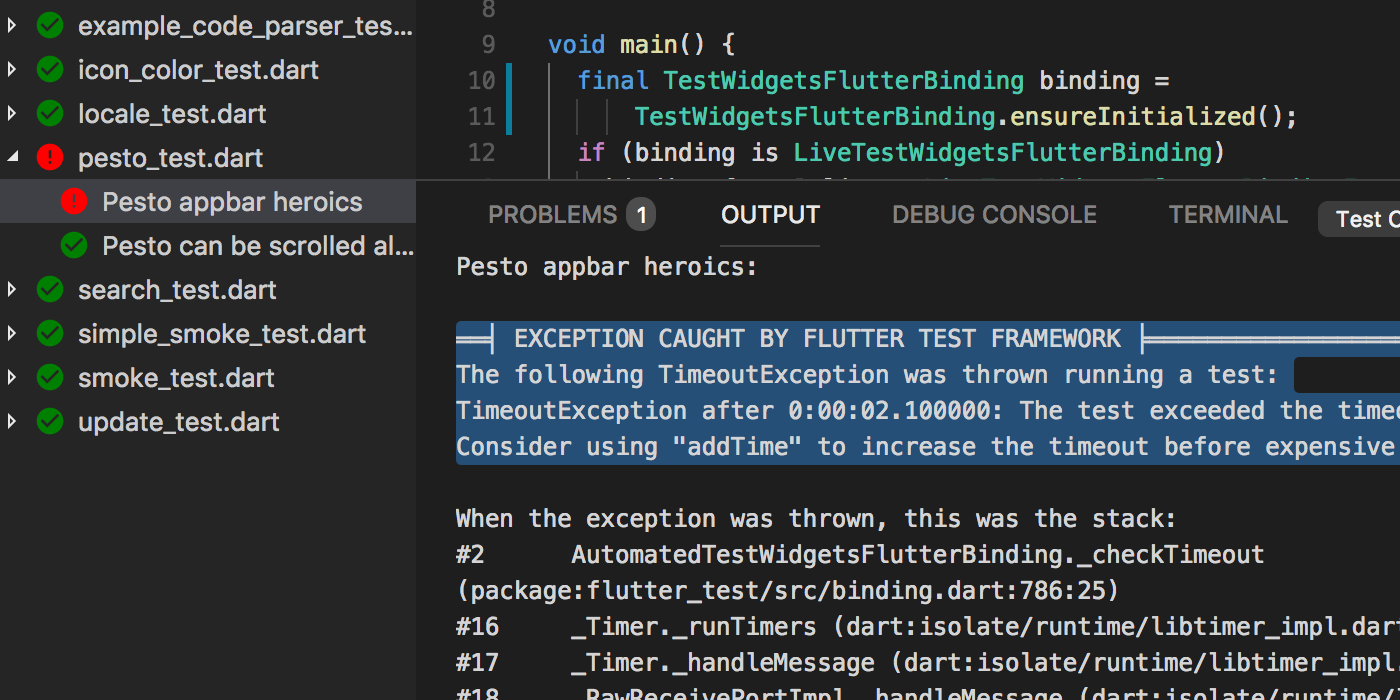
Note: By default this is only enabled for Flutter projects. You can opt-in for Dart projects by setting the dart.previewTestRunnerForDart setting to true though there may be some edge cases where this currently does not work correctly.
Run All Tests
A new command has been added to quickly run all tests in your project (the equivalent of flutter test or pub run test). This command will spawn a concurrent debug session for each workspace folder that contains tests.

Go To Implementation
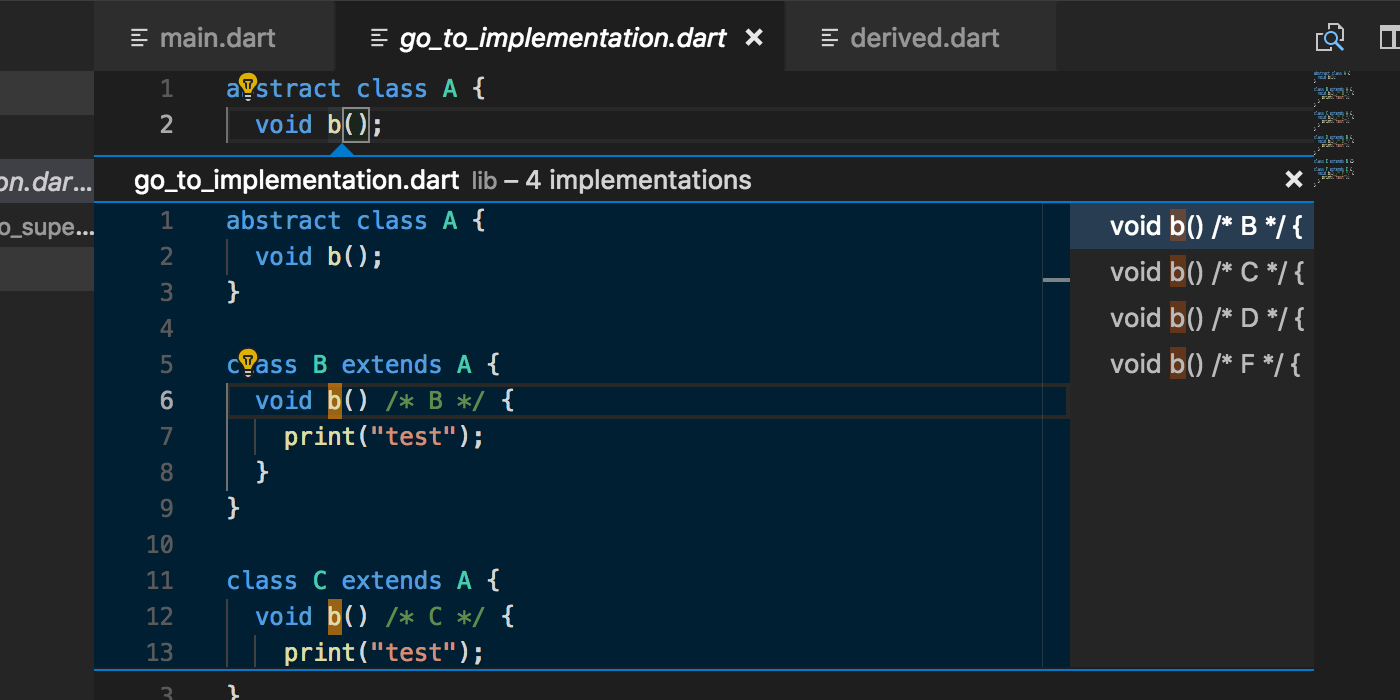
Go To Implementation has been implemented to allow you to quickly jump to implementations from abstract members/interfaces.
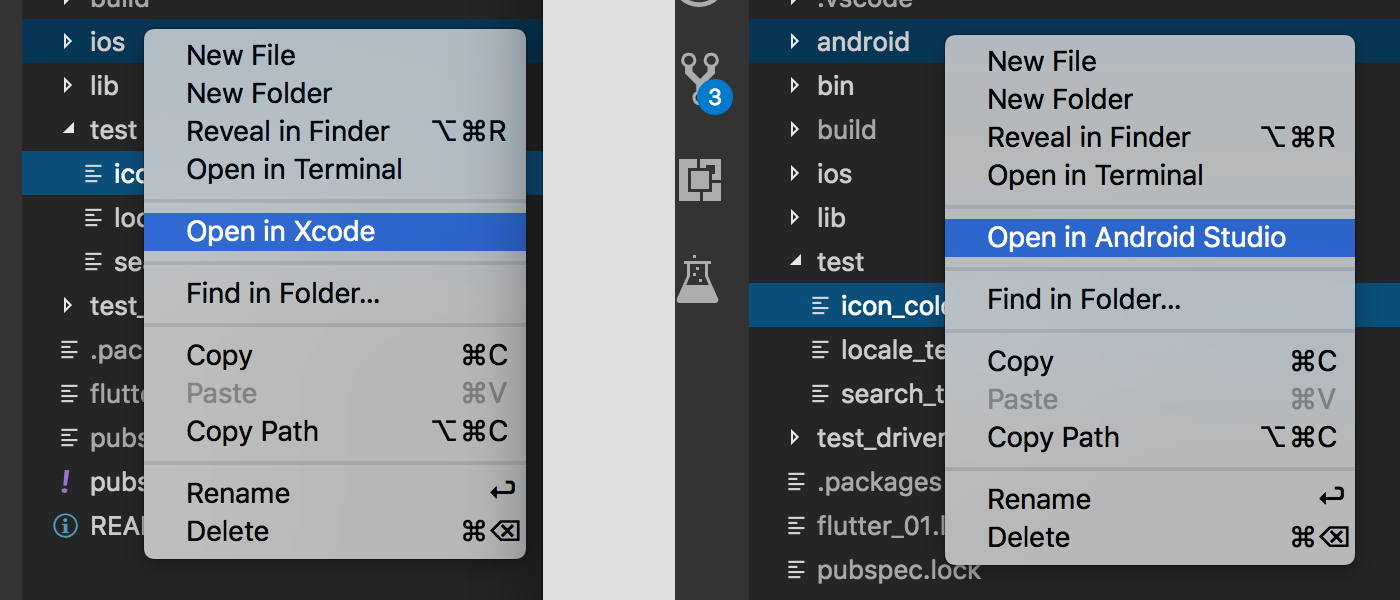
Quickly Open in Android Studio or Xcode
New context menu entries have been added to ios and android folders to allow you to quickly open them in Xcode or Android Studio.
Filtered Extension Logging
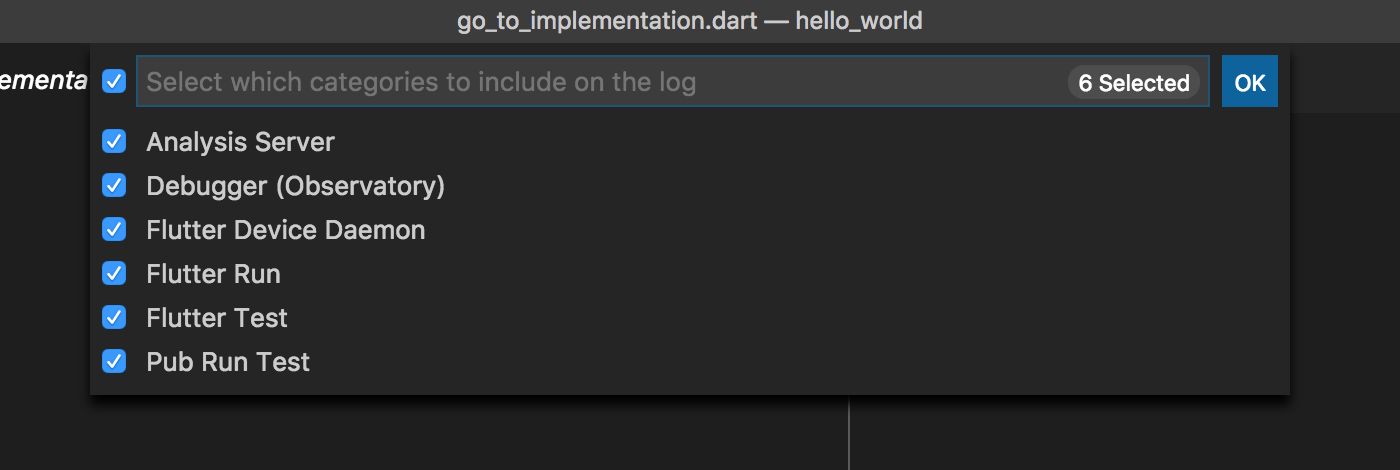
The Dart: Capture Logs command has been extended to allow selection of which log categories to include when troubleshooting or reporting issues in the extension.
Other Changes
- Handling of concurrent Dart or Flutter debug sessions has been improved and commands that work on a specific debug session (for example
Open Observatory) will now prompt you to select a session throwing plain instances likeStrings will now show correct values in theVariables > Exceptionsdebugger pane instead of only the fields of the instance- Evaluating expressions in the Watch pane will now time out after 1 second to avoid hanging when no response is received
- Launching debug sessions from multi-root workspaces where there are no
launch.jsonfiles has been made more reliable Copy Valuein the Variables and Watch debugger panes should no longer truncate the values added to the clipboard- Additional instances of exception messages being truncated in the debugger have been resolved
- Log files created using the Dart: Capture Logs command will now be prefixed with some information about the SDKs that have been loaded
- Workspace symbols are now assigned more accurate ranges
- Refactors that edit multiple files are less likely to record multiple undo steps
Upstream Issues
Some feature requests and fixes require new features and fixes in upstream projects like VS Code and LSP which use counts of 👍s on those issues to help gauge demand. The Dart-Code website now lists some of the most significant upstream issues with a description of the feature/fix they would enable. Please consider reviewing this list and adding your 👍 to any GitHub issues relevant to features you’d like to see!


