Debugging Commands
Dart Code adds a number of commands to the command palette (Ctrl+Shift+P or Cmd+Shift+P) during a debugging session.
- Adding Key Bindings for Commands
- Flutter: Hot Reload
- Flutter: Hot Restart
- Flutter: Inspect Widget
- Dart: Open DevTools
- Flutter: Open Observatory Timeline
- Flutter: Toggle Baseline Painting
- Flutter: Toggle Debug Painting
- Flutter: Toggle Performance Overlay
- Flutter: Toggle Platform
- Flutter: Toggle Repaint Rainbow
- Flutter: Toggle Slow Animations
- Flutter: Toggle Debug Mode Banner
Adding Key Bindings for Commands
For information on key bindings, including how to add your own, see Key Bindings
Flutter: Hot Reload
This command invokes injects updated source code into the Dart VM on your device/simulator to allow instant updates without having to restart your application. For more information on hot reload visit flutter.dev/…/hot-reload. Flutter: Hot Reload is automatically executed whenever you save a source file if you’re in a Flutter debugging session and there are no compile errors (this can be disabled with the dart.flutterHotReloadOnSave setting).
Flutter: Hot Restart
Certain types of changes are not supported by hot reload (see here) so you must perform a hot restart. Hot restarts deploy latest source code to your device/simulator and restarts your application. Although slightly slower than a hot reload a hot restart is still usually very fast (a few seconds), much quicker than stopping the debug session and rebuilding/deploying.
Flutter: Inspect Widget
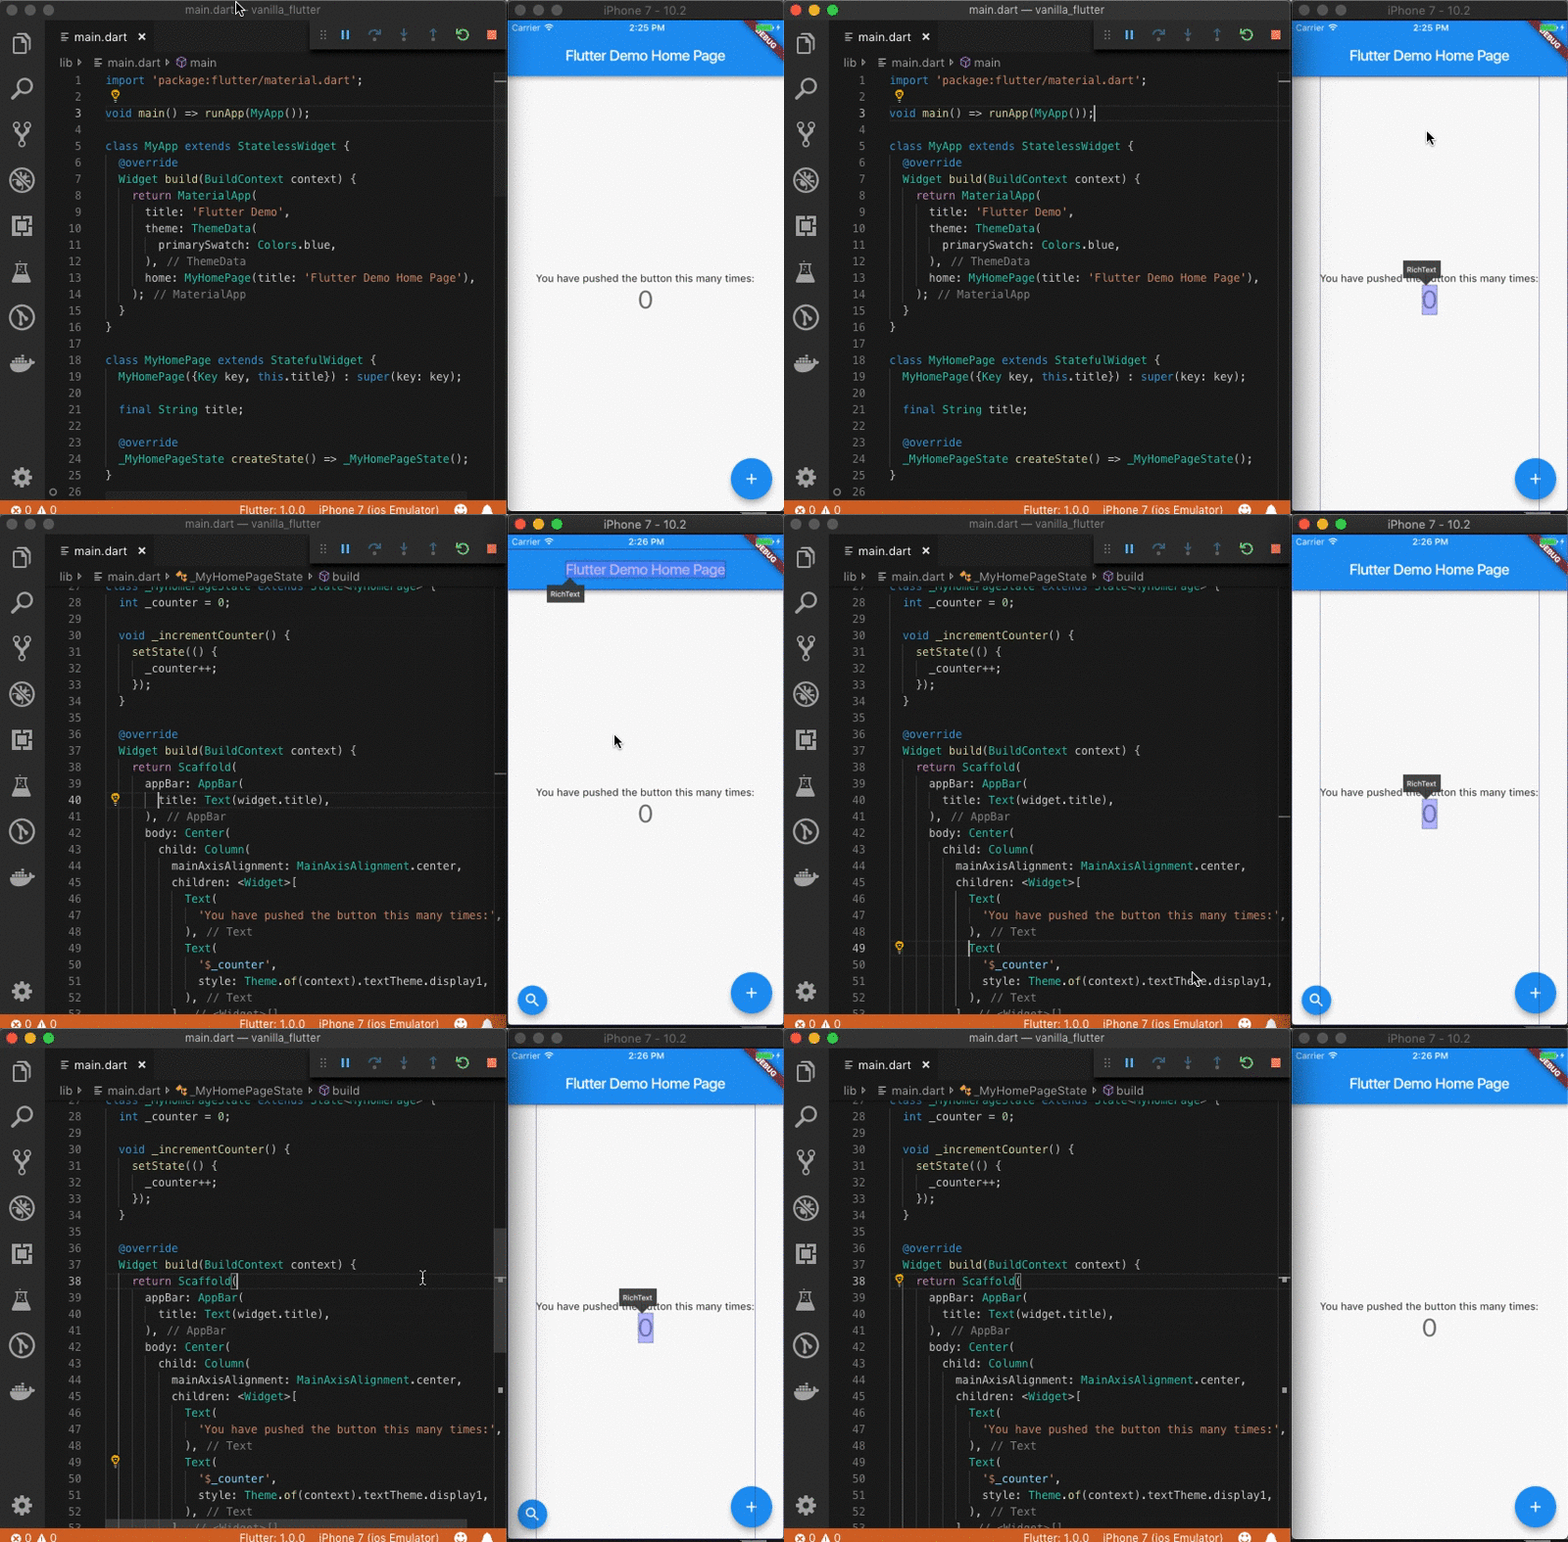
This command enables Flutter Widget Inspection. Click on a widget in your application and it will navigate VS Code to the location in your source code where the widget is constructed. To select another widget, click on the magnifying glass and select another widget. To cancel out of Flutter Widget Inspection, a separate command Flutter: Cancel Widget Inspection is enabled that will cancel out of widget inspection.
Here’s a quick demo of it in action:

Dart: Open DevTools
This command will open the DevTools application in your web browser. For more information on using this tool to debug your Flutter application visit flutter.dev/…/debugging.
Flutter: Open Observatory Timeline
This command opens the Timeline view of the Observatory tool which can be useful for debugging performance issues.
Flutter: Toggle Baseline Painting
This command toggles the painting of baselines in your Flutter application.
Flutter: Toggle Debug Painting
This command toggles debug painting in your Flutter application to help you understand how widgets are laid out on the screen.
Flutter: Toggle Performance Overlay
This command toggles the rendering of a performance graph at the top of your application (on the device) to help diagnose performance issues. For more information on the overlay visit flutter.dev/…/ui-performance.
Flutter: Toggle Platform
This command toggles between Android and iOS platform rendering to allow easier testing of platform-specific rendering without having to use two devices.
Flutter: Toggle Repaint Rainbow
This command toggles painting different colors in areas of the screen as they are painted. This helps understand which areas of the screen are/aren’t being repainted.
Flutter: Toggle Slow Animations
This command toggles the speed of animations between normal and one sixth normal speed to help troubleshoot when something isn’t animating as expected.
Flutter: Toggle Debug Mode Banner
When taking screenshots of your Flutter application during development it may be convenient to hide the Debug banner without having to rebuild your app. If you’re running your Flutter app via the VS Code debugger then you can use the Flutter: Toggle Debug-Mode Banner command to show or hide the banner.


